|
|
|||||||||||||||||||||||||||||
|
|
||||||||||||
|
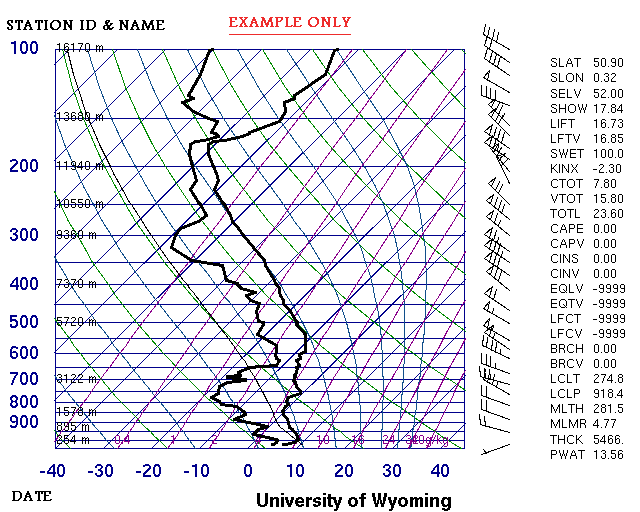
Atmospheric Soundings are profiles of the atmosphere taken from specific locations around the world at 00Z and 12Z daily using either a weather balloon or missile launched sensor package. The following portal from the University of Wyoming provides world-wide atmospheric profile data. Select from various tables or charts available using the “type of plot” drop-down. The most useful chart available is the GIF SKEW-T which provides a graphical profile of the atmosphere from the launch height typically upto around the 100mb level. Select the station ID from the drop-down list. For southern uk, the main choices are:
Pressure and height are shown on the left axis, windspeed on the right and isotherms drawn skewed from the horizontal axis. The right hand thick line signifies temperature and the left hand line signifies the dew point. Where these lines meet saturation occurs, and depending on the amount of precipitable water in the column of atmosphere signified by the PWAT indicator this may lead to precipitation. A key to the abbreviations used on the right of the chart can be found HERE. Where saturation occurs above the freezing level, ice may form. Where saturation occurs at ground level fog will form. Each sounding provides a huge amount of data about the state of the atmosphere and is a powerful tool for forecasters. Click HERE for the University of Wyoming Sounding Data Example Sounding: |
 |
|
|
|
| like button |

